Tracking the Performance of Your Machine Learning Models With MLflow
Hit the Ground Running and Start Tracking Your Machine Learning System

Posted by Pablo Lorenzatto
on February 12, 2021 · 8 mins read
In our Delivering Your Marketplace's Orders in Time with Machine Learning entry we talked about how important it is to track the results of Machine Learning experiments and pipelines. There are lots of parts that are constantly being tweaked and need to be considered: different models, features, parameters, changing data sources, hyper-parameters and new ways of training the algorithm altogether. The only way to know the effect of those changes is to monitor them.
This is why we use MLflow at MUTT DATA. We found that it's a great tool for tracking the results of our experiments in production environments, and it helped us improve how we communicate the results of our Machine Learning systems to our clients. This why Machine Learning Operations (MLOps) is more important than ever: it's no longer enough to have good results on our predictions or forecasts, we need to make the whole system reliable, monitorable, automatic and scalable
This post serves both as a standalone entry and as a technical Addendum to the Delivering Your Marketplace's Orders in Time with Machine Learning post. You won't find the basics and fundamentals of MLflow here, but instead some tips and tricks we've learned along the way to help you hit the ground running as quickly and efficiently as possible.
All of the code and examples used for this post are in this repository: MuttData/mlflow_article_code. Feel free to run, modify and play around with the code snippets as you please!
What you'll learn in this post
During this entry we'll show how to easily setup MLflow's server, UI and database using docker-compose.
Then we'll implement the tips mentioned in Delivering Your Marketplace's Orders in Time with Machine Learning:
- Defining a good experiment and run name
- Using parameters to track features and important configurations
- Saving useful files as artifacts
- Querying the results of your experiments locally
There's a lot more to do and show with MLflow, but we hope these tricks and code samples help you start tracking your Machine Learning experiments as quickly as possible!
Tracking in the Machine Learning lifecycle
Machine Learning is still a piece of software, and being aware of its performance is key. We need to know if our latest changes affected the performance positively or not, and checking its results once during development is not enough. After deployment the system starts working with real data and multiple things could happen. Best case scenario the results are consistently better, but it could also happen that its performance starts out fine but starts degrading over time! The only way to be aware of this is to constantly track and monitor its results.
We use MLflow to do this: it provides a tracking server where it's possible to store parameters, metrics and artifacts (files such as .png plots or .csv files) and a good UI where anyone can check its results.
If you want to know more about it, check out its amazing documentation and quickstart.
After working with it for some time, we have some tips and tricks to share that will hopefully make jumping into it and start tracking your results a better experience.
We'll use a Time Series of retail sales, one of the samples from the Prophet repository.

Our code just serves as an example of how one could make use of MLflow to track a Machine Learning solution, so it uses extremely naive models and features.
Setting things up
MLflow has two key components: the tracking server and the UI. To start interacting with them, we'll need to spin up these services.
Manually installing and maintaining two services like these can be a bit of a headache sometimes.
And not only that, but if you want to safely store the results of your experiments you'll need to boot up a database.
This is where docker-compose comes in to save the day, since it makes setting up all those services together and changing their configurations a piece of cake.
This a simple docker-compose "recipe" to quickly start up MLflow and its required services. This docker-compose would need a few tweaks for a production environment (for example by spinning up ngnix for authentication), but it's a great way to get into it and start using it:
version: '3'
services:
    postgresql:
        image: postgres:10.5
        environment:
            POSTGRES_USER: ${POSTGRES_USER}
            POSTGRES_PASSWORD: ${POSTGRES_PASSWORD}
            POSTGRES_DB: mlflow-db
            POSTGRES_INITDB_ARGS: "--encoding=UTF-8"
            restart: always
        volumes:
            - mlflow-db:/var/lib/postgresql/data
        ports:
            - 0.0.0.0:5432:5432
    waitfordb:
        image: dadarek/wait-for-dependencies
        depends_on:
            - postgresql
        command: postgresql:5432
    mlflow-server:
        build: .
        ports:
            - 0.0.0.0:5000:5000
        environment:
            DB_URI: postgresql+psycopg2://${POSTGRES_USER}:${POSTGRES_PASSWORD}@postgresql:5432/mlflow-db
            MLFLOW_ARTIFACT_ROOT: "${MLFLOW_ARTIFACT_ROOT}"
            MLFLOW_TRACKING_USERNAME: "${MLFLOW_TRACKING_USERNAME}"
            MLFLOW_TRACKING_PASSWORD: "${MLFLOW_TRACKING_PASSWORD}"
        restart: always
        depends_on:
            - waitfordb
        volumes:
               - "${MLFLOW_ARTIFACT_ROOT}:${MLFLOW_ARTIFACT_ROOT}"
    mlflow-ui:
        build: .
        ports:
            - 0.0.0.0:80:80
        environment:
            DB_URI: postgresql+psycopg2://${POSTGRES_USER}:${POSTGRES_PASSWORD}@postgresql:5432/mlflow-db
            MLFLOW_TRACKING_USERNAME: "${MLFLOW_TRACKING_USERNAME}"
            MLFLOW_TRACKING_PASSWORD: "${MLFLOW_TRACKING_PASSWORD}"
            MLFLOW_ARTIFACT_ROOT: "${MLFLOW_ARTIFACT_ROOT}"
        restart: always
        depends_on:
            - mlflow-server
        entrypoint: ./start_ui.sh
        volumes:
                - "${MLFLOW_ARTIFACT_ROOT}:${MLFLOW_ARTIFACT_ROOT}"

volumes:
    - mlflow-db:
        driver: local
Run docker-compose up and you'll be ready to go!
In a nutshell, this docker-compose will boot up a PostgreSQL database for storing results, MLflow's server at port 5000 and it's UI at port 80.
Some configurations can be changed by modifying the .env file. MLflow will be storing its files in /tmp/mlruns by default, but you can change that by modifying the .env file in the repository.
This should be enough for an initial setup, but if you want to make sure all these services stay up after deploying them, using a tool like supervisord is a great idea. It's a Process Control System, where you can easily configure the restart of processes if they ever go down.
Starting to track metrics and parameters
Let's start by training a XGBoost model and then tracking some metrics and parameters. It's easy enough to start tracking some metrics using MLflow's API:
with mlflow.start_run():

    [...]

     # Compute MSE metric
    mse = mean_squared_error(y, y_hat)
    mlflow.log_param("MSE", mse)
You can run this file in the repository to do just that.
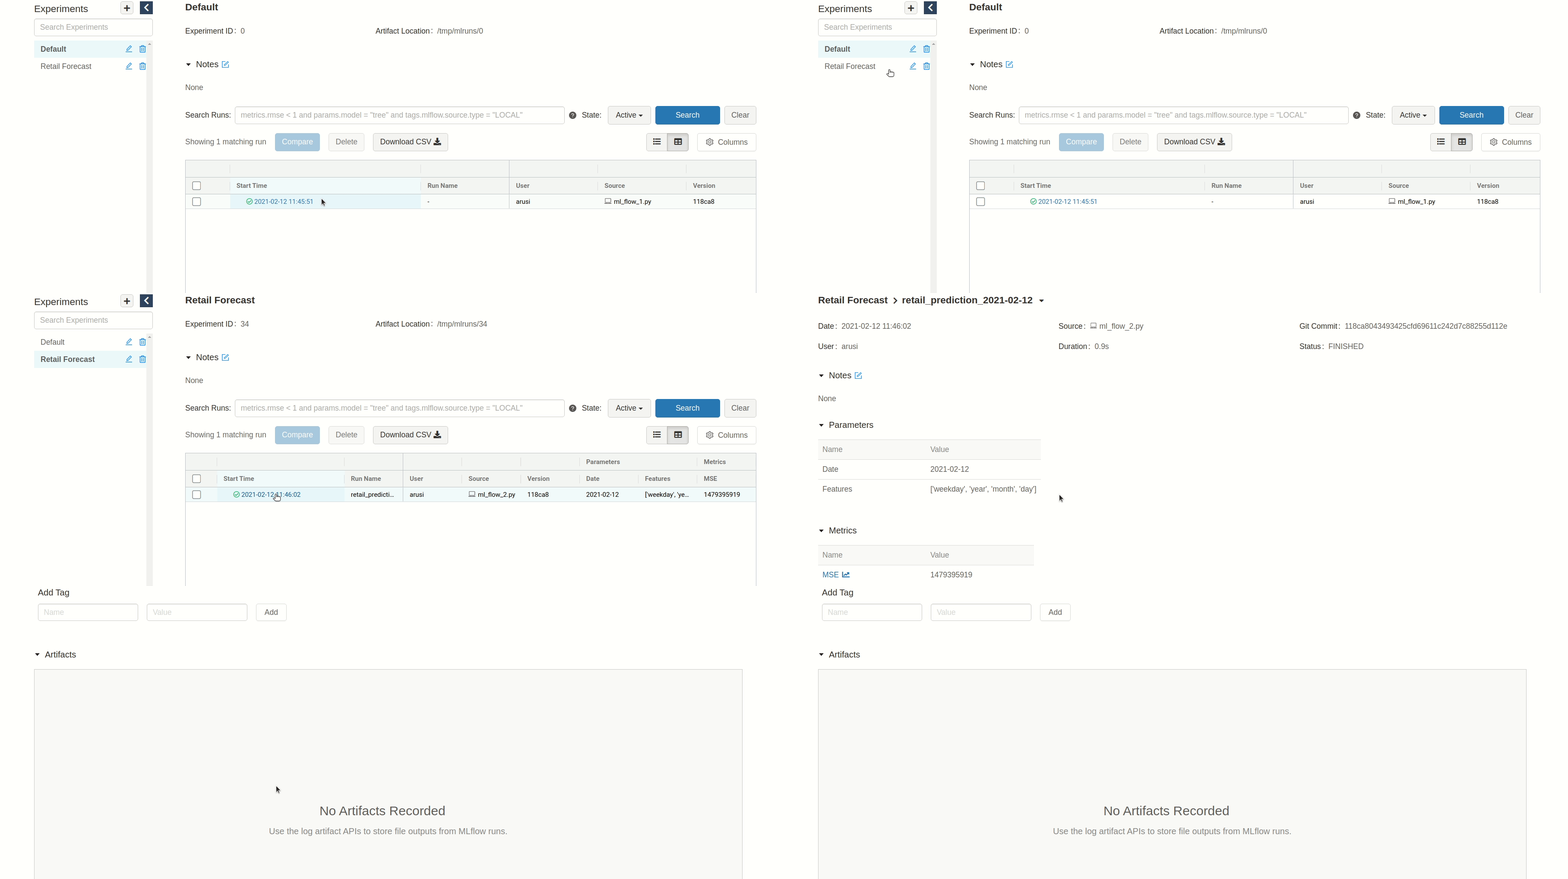
After this the UI will have an entry for your experiment:
But this is not ideal: we've got no way to differentiate between experiments besides its Start Time, tracking a single metric doesn't seem that useful and we don't know anything about the features, hyper-parameters or configurations used.
To differentiate between your runs, make sure to have a good and searchable experiment and run name.
Think of experiment names as a way to group your whole project, and run name as a way to differentiate the type of run you were doing.
For example, Retail Forecast could be a good experiment name and retail_prediction_<RUN_DATE> could work as a run name.
But that's not all, it's important to track the features you used. This way you'll know what caused your results. An easy way of doing this is to track the name of the feature columns you used during training.
current_date = date.today()
experiment_id = mlflow.set_experiment("Retail Forecast")
[...]
with mlflow.start_run(run_name=f"retail_prediction_{current_date}"):

    [...]

    # Compute MSE metric
    mse = mean_squared_error(y, y_hat)
    mlflow.log_param("MSE", mse)

    # Track features
    mlflow.log_param("Features", X.columns.tolist())
    mlflow.log_param("Date", current_date)
Now we know exactly what features we used during training.
The code with these changes can be seen here.
Saving plots and files
We are gonna have to track more than metrics and parameters if we want to understand our results. Since we are predicting a Time Series, a line plot will help understand how our predictions are looking. Similarly to previous examples, we can do this with MLflow's API:
with mlflow.start_run(run_name=f"retail_prediction_{current_date}"):
    [...]
        # Save plot to MLFlow
        fig, ax = create_line_plot(X_test, y_test, yhat_test)
        fig.savefig(f"{MLFLOW_ARTIFACT_ROOT}/line_plot.png")
        mlflow.log_artifact(f"{MLFLOW_ARTIFACT_ROOT}/line_plot.png")
        plt.close()
    [...]
But sometimes having a bit of raw data around is a good idea as well, just to know what we were working with when we trained our algorithm.
MLflow supports .csv and even interactive extensions such as .html!
        # Save a sample of raw data as an artifact
        sample_data = X_test.sample(min(MIN_SAMPLE_OUTPUT, len(X_test)))
        sample_data.to_csv(f"{MLFLOW_ARTIFACT_ROOT}/sample_data.csv")
        mlflow.log_artifact(f"{MLFLOW_ARTIFACT_ROOT}/sample_data.csv")
You can find the code that does this here.
When running this in production, you'll probably run out of disk space if you are using a single instance to store your artifacts. Luckily, MLflow handles connections to object storage services such as S3, Azure Blob and Google Cloud Storage quite gracefully. For example for S3 you can link it to your tracking server when booting it up:
mlflow server \
    --backend-store-uri /mnt/persistent-disk \
    --default-artifact-root s3://my-mlflow-bucket/ \
    --host 0.0.0.0
Make sure your instance or docker image contain the necessary permissions to access the bucket though!
Nested Runs
Let's go to the next step: let's say you wanted to track the performance of multiple models, to then decide which one was the best. Tracking parameters like we did before will do the trick, but to be even more tidy we'll make use of another tool: nested runs. Since we're gonna be tracking a bunch of runs at the same time, this will group them together:
experiment_id = mlflow.set_experiment("Retail Forecast")
KNOWN_REGRESSORS = {
    r.__name__: r
    for r in [LinearRegression, XGBRegressor, RandomForestRegressor, LGBMClassifier]
}

with mlflow.start_run(
    run_name=f"retail_prediction_{current_date}",
    experiment_id=experiment_id,
):
    [...]
    for model_name, model_class in KNOWN_REGRESSORS.items():
        with mlflow.start_run(
            run_name=f"retail_prediction_{model_name}_{current_date}",
            experiment_id=experiment_id,
            nested=True,
        ):
            [...]
            # Compute MSE metric
            mse = mean_squared_error(y_test, yhat_test)
            mlflow.log_metric("MSE", mse)

            # Track features
            mlflow.log_param("Features", X.columns.tolist())
            mlflow.log_param("Model", model_name)

Our final version of the code with nested runs will look like this.
Querying your results
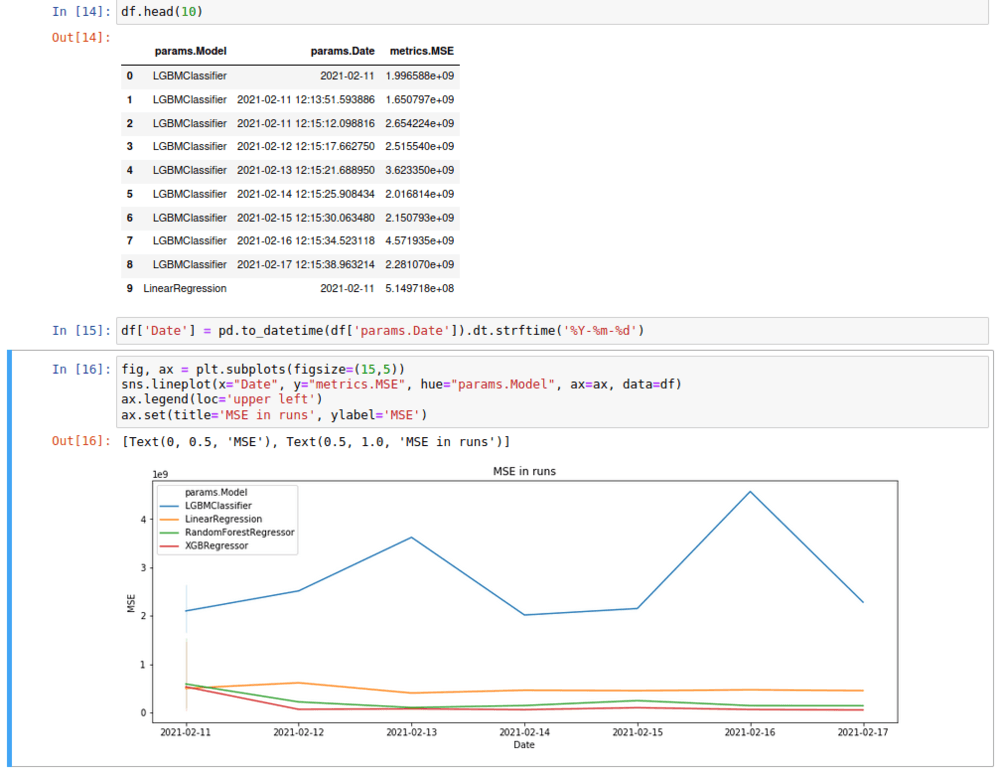
But what if we've been running these experiments for a while now, and checking multiple results by hand in the UI is no longer an option?
We can use MLflow's programmatic queries and get all the results in a handy DataFrame format, so we can do some analysis and plots on it.
We just need to connect to MLflow as we always do, and then search for our experiment:
mlflow.set_tracking_uri(
    "http://{username}:{password}@{host}:{port}".format(**mlflow_settings)
)
df = mlflow.search_runs(
    experiment_ids=experiment_id,
)
We can then work with that DataFrame as always.
We do exactly that in our Jupyter-notebook.
Closing remarks
After reading this article you should be able to spin up your own MLflow service and also start tracking your own metrics.
Machine Learning Operations (MLOps) is more important than ever, and MLflow is a great tool to do just that. And it's not only useful for tracking, but also for packaging your code to be reusable and reproducible without having to worry about dependencies (and even dockerize your package!) and for deploying your model in diverse environments. Make sure to check them out!
References
MLflow documentation. URL
The source of the header picture is Wikimedia Commons:
MassStandards 005: by the National Institute of Standards and Technology. URL