
A/B Testing 101
On building and understanding your own A/B experiment

Posted by Alejandro Rusi
on June 1, 2020 · 11 mins read
Why you should A/B test
Great! So the new change you just introduced to your landing page is working better! Well, at least that's what it seems because you are getting more clicks than last week, or maybe you see more users are reaching your checkout page and spending more money there. But are you really sure about it being better than the last version? The metrics you care about might be performing better for now, but how do we know if this success happened because of it being a real improvement and not because of a seasonal event (for example, near payday or Christmas)? And what if a few weeks later, its performance starts getting worse? Do we just rollback to the first version?
This problem is not uncommon when deploying Machine Learning models as well. You'll probably iterate and deploy new versions of your model many times, constantly changing up its results. For example, if you have made a breakthrough on your recommendation system, it might be tempting to just deploy the new model directly and use this new algorithm to decide what recommendations ALL users will be receiving. But what if it actually performs worse than the last version! It might happen that the users just liked the old recommendations better.

What is an A/B test?
This is where A/B testing comes in. An A/B Test is a statistical tool which compares two variants , A and B (hence its name!) usually referred as Control and Treatment (the one you started with and the one you want to try out). The Treatment should introduce the change you want to try out, and a portion of your users should be exposed to it while the rest should keep being exposed to Control. After a certain amount of time, the A/B test will tell us just how sure we are of one variant being better than the other.
This idea is used everywhere nowadays, be it to know just how statistically significant is a scientific experiment or to understand the engagement and satisfaction of users of an app or website. There are a lot of things to know for running this experiment and more importantly to correctly understand and make a correct interpretation of its results.
In this entry we want to give you the fundamentals for implementing and understanding your own A/B test and give you tips to avoid falling for the many usual mistakes that could happen when running and interpreting your experiments. We will be talking about A/B testing using a frequentist approach, which is the most common framework. Its quite simple to implement, but its results might be a bit tricky to make sense of.
First steps
There are a few things to do before we can jump into running an A/B test:
- Define your target metric and get your data
An A/B test is a data-driven process. You can't run your experiment if you don't have data on how your users are responding to your app! This goes hand in hand with the metric you want to experiment with: are you interested in improving the click rate of a certain page, or maybe you care about more users reaching your checkout page after exposing them to some special offer? The important thing here is that you should decide on just one metric, and this metric should be key to your business. Also think of your analysis-unit: is it users, sessions, cookies, days or what exactly? You should be able to pull data at this unit's level, for your desired metric.
- Create your treatment variation and split your users
After knowing what to experiment with, you can create your treatment variation. Maybe it's a new and slick landing page or a new feature you are not entirely sure if it will be a hit with your users. The important thing is that you should know which users fell into the Control and Treatment variant, and that they keep consistently seeing their assigned variant during the experiment.
Hashing is the way to go for this task, a good rule of thumb is to combine the name of your experiment with the user id and hash using a standard hashing function like MD5. Then you can get the modulo of the resulting hash to divide up your users. Want a 50/50 split? Just assign the users with the last digit of their hash ending in 0-4 to one variant, and the ones ending in 5-9 to the other. Want to assign just 10% of your users to each variant? Same thing, run a modulo operation, and the users whose hash end up with 00-09 should get one variant and the users whose hash end up in 10-19 the other.
- Define your hypothesis and your sample size
Defining an hypothesis might be the toughest part when designing your experiment. After you know what metric you want to use for your experiment and what will you use as your variant, you have to make a concrete hypothesis. Due to your change, what is the user behaviour that you expect to change? And how much do you expect to affect your key metric?
Knowing this lets us define our sample size using a simple calculator. For example, say we want to measure the click rate of a checkout button, and we already know it has a click rate of 20%. If we want to be able to detect an effect of at least 5% relative to the current click rate, we'd need 25,255 users per variation taking part in the experiment. More on how to use this calculator and its parameters such as p-value and statistical power later!

- Know your null hypothesis!
You'll be running your experiment on a null hypothesis, which is what you'll want to discard or not discard. You already have your hypothesis for what you expect of your A/B test, but the null hypothesis is tightly tied with the implementation of your test. For example the t-test can test the null hypothesis that the means of two sample populations are equal.
To give a concrete example, let's say you have been doing an experiment on the click rate of a checkout button and you have reached the necessary sample size required to get the answer to your A/B test.
After checking the click rate, you see that the Control variant has a rate of 3% while Treatment has a rate of 5%.
Thankfully enough, click rate is the mean of the users that clicked the button! A perfect fit for running a t-test.
From its results you'll be able to learn if their means are statiscally different and if one is better than the other, but first you'll need to learn to understand its results.
Understanding the results
Now that we know what we need to start our A/B test, its time we get into what are its results. Before when we were defining our sample size with the calculator we could have also chosen the desired p-value and statistical power of the experiment. These are key concepts for understanding a frequentist A/B test.
p value
After understanding our null hypothesis, we want to be sure just how confident we are on these results. On a nutshell, a p-value is the probability that after seeing our samples, the null hypothesis is true. A high p-value means your data are likely to follow the null hypothesis, while a low value means that the observations are not very likely to follow it.
For example for the t-test previously mentioned, if we run it and get a high p-value we can assess that it might be possible that there is no difference between the means of the samples, while a low value means that we have enough evidence to reject this hypothesis, letting us confirm that the mean of the samples are different enough.
A commonly used threshold for confirming if the results are statistically significant is , meaning there is a chance of the null hypothesis being correct (and its results are just by chance).
Statistical Power
The strength of your experiment, the probability of not rejecting the null hypothesis when in fact there was enough difference in the samples to discard it.
A higher Power means a lower probability for making this error (but it means you'll need more samples to make sure this happens!).
A common value for the statistical power is , or if we look at it the other way around, that you are OK with not rejecting the null hypothesis the of the time.
Putting it all together
Now, let's use all that we've learned to run our own experiment: we want to deploy a News Article recommendation system based on Deep Learning to compete against our previous implementation using Matrix Factorization and check if more users are clicking on the recommendations being shown. We already know our old Matrix Factorization recommendation system has a click rate of 20%. Let's work the experiment step-by-step.
- Define the target metric: since we want to see if more users are clicking what we are recommending, we can use a click rate (from now on CTR) as our target metric.
- Get the necessary data: without data we won't be able to run the experiment. We'll need to store all user events in our website, and be able to differentiate between each individual user and know if they have been exposed to the Control or Treatment variation.
Let's say that we end up with a Dataframe that looks like this:
| date | click | variant |
|---|---|---|
| 2020-06-17 | 0 | Control |
| 2020-06-17 | 0 | Treatment |
| 2020-06-17 | 0 | Control |
| 2020-06-17 | 1 | Treatment |
-
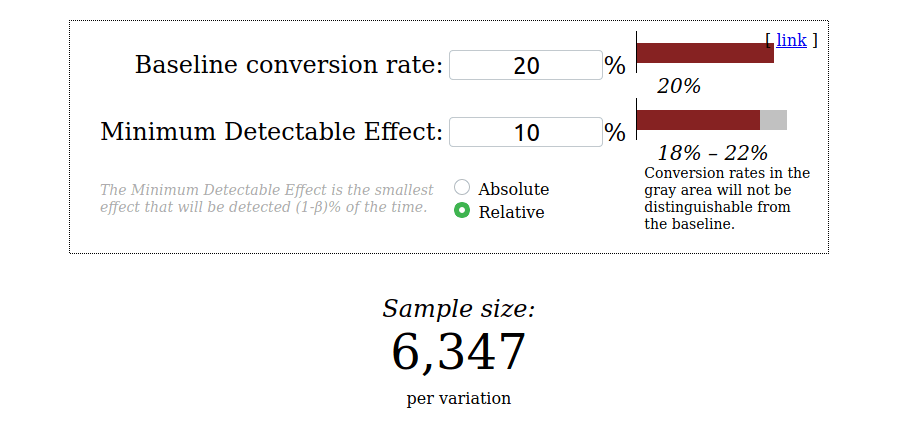
Define a hypothesis: our hypothesis will be that our new recommendation system is not better by a certain percentage. At least that's what our gut tells us after trying it out for ourselves. We'll be conservative though, and expect that our new system will perform at least 10% better than the original.
-
Get the sample size from the calculator: we'll run the same calculator with our values: a baseline conversion rate of 20% and Minimum Detectable Effect of 10%. We'll use the classic threshold of 5% for the
p-valueand 80% for thestatistical power.
-
Know our null hypothesis and test: in this case the
t-testis a perfect fit, since we want to compare the means of our samples (the CTR in this case). We'll usescipy's implementation of t-test, and see if we can reject the null hypothesis. -
Run the experiment: this is actually the easy part! After running the experiment for a week we end up with even more samples than required, allowing us to confidently check the results. Let's split the Control and Treatment results into their own array, and run the
t-test:
from scipy.stats import ttest_ind

control = df[df['variant'] == 'Control']
treatment = df[df['variant'] == 'Treatment']

statistic, pvalue = ttest_ind(control['click'], treatment['click'])
print(f'P-value: {pvalue}')
print(f'Is the p-value smaller than the threshold? {pvalue < 0.05}')
- Understand the results: running the previous code we get the good news that our
p-valueis smaller than the threshold!
P-value: 1.0883040680514908e-66
Is the p-value smaller than the threshold? True
Getting into the data we can see that Treatment has a conversion rate of 40%. With this, we can safely say that our new implementation is performing, at the least, better.
The sins of A/B testing
As you can see, running a Frequentist A/B test is not hard, but has a lot of moving parts that you need to know to properly understand its requirements and results. A lot of mistakes can be made when running A/B tests!
- Don't deploy code while running
Deploying code that makes big changes means that your experiment is over. If you keep it running, you'd be experimenting with two completely implementations of a variant! You'll never know if your new variant is performing better or worse because of the way it was pre or post deploy. Of course making quick fixes is OK, as long they are small and both variants have been running properly (if one of them has been redirecting users to an error page, start over!).
- Consequences of bad hashes
Previously we mentioned just how important a good hashing function is for correctly splitting our users. But what would happen if we don't use it at all? Say we just use a modulo function, getting the last digits of the user id and using that to split them into different groups. But what if those distributions are uneven, with a certain user type more likely to have a certain last digit? And make notice that when your experiment is over, re-using the same modulo function for a new experiment would split the users in the same way! We don't want that since the results of the last experiment would affect the new one, with users maybe being more or less content depending on the last variation they saw.
- No peeking!
Lots of statistical sins are committed when trying to find out the significance of A/B test. For example, doing an early stop of your experiment (called the peeking problem) entails making a decision before reaching the required sample size, stopping the experiment earlier than it's supposed to end. It's a classic problem which hurts us the most when we are anxious to make a decision on our test. It's tempting to make decisions before the experiment ends (specially if we like the results we are seeing!). There is no problem on monitoring and looking at the current status of our experiment, but we should avoid making decisions on those peeks at all costs. It really is not the same to peek multiple times at our p-value and try to make a decision each time if we like its results than to use the results acquired after reaching the required stopping point (here and here are great sources on this issue!).
Alternatives
We mentioned many characteristics of frequentist testing which are kind of annoying: it doesn't allow us to stop the experiment early, and understanding things like the p-value is not easy! Plus, on our example we worked expecting to see big changes with our Treatment variant. After a certain point, your experiments will probably be about getting a small (but still important) increase in your key metric. And the smaller the expected change, the bigger the sample size needed to detect it!
What if we want to get correct inferences from our experiment without requiring to obtain all of our samples, or what if we want to safely stop it early because we are actually seeing a strong good or bad performance?
What can we do to tackle these issues of A/B testing? Luckily enough, we can use some alternative approaches for our experiments:
- Frequentist sequential A/B testing: tackles the peeking problem and allows multiple "stop checkpoints", where we can safely stop our experiment instead of doing it earlier than supposed.
- Bayesian A/B testing: solves the peeking problem by letting you look at the experiment anytime and still make perfect valid inferences from it.
Closing remarks
As you can see, there are lots of moving parts to understand in an A/B test. Its frequentist version is simple to implement, but quite tough to grasp. That's why its important to comprehend its fundamentals, and always make sure to learn from people who have fallen into the muddy parts of A/B testings and came out alive!
There are lots of topics to keep expanding our A/B knowledge, such as experimenting with Non binomial metrics and the alternatives to frequentist testing previously mentioned. Stay tuned for future entries on these topics and more!
References
Miller, Evan. “Sample Size Calculator.” Evan’s Awesome A/B Tools, URL
Miller, Evan. “How Not To Run an A/B Test.” Evan Miller, 18 April 201, URL
Trencseni, Marton. “Beautiful A/B testing.” Bytepawn, 05 June 2016, URL
Mullin, Shanelle. “The Complete Guide to A/B Testing: Expert Tips from Google, HubSpot and More.” Shopify, 10 April 2020, URL
Draper, Paul. “ The Fatal Flaw of A/B Tests: Peeking.” Lucidchart, URL
Pictures in this entry belong to the History of science from Wikimedia Commons:
Montgolfier: Cyrille Largillier / CC BY-SA (https://creativecommons.org/licenses/by-sa/4.0).
The alchemist: Carl Spitzweg / Public domain.